Core Web Vitals: how the metrics work
Overview
Core Web Vitals solve a narrower problem than “page speed.” They define a small field-measurable set of user-experience signals that can be compared across websites: perceived loading speed, interaction responsiveness, and visual stability. The current set is Largest Contentful Paint, Interaction to Next Paint, and Cumulative Layout Shift. First Input Delay is no longer a current Core Web Vital; it was replaced by Interaction to Next Paint in 2024 because FID measured only the delay before the first event handler began, while INP covers the full interaction latency through the next visual update.
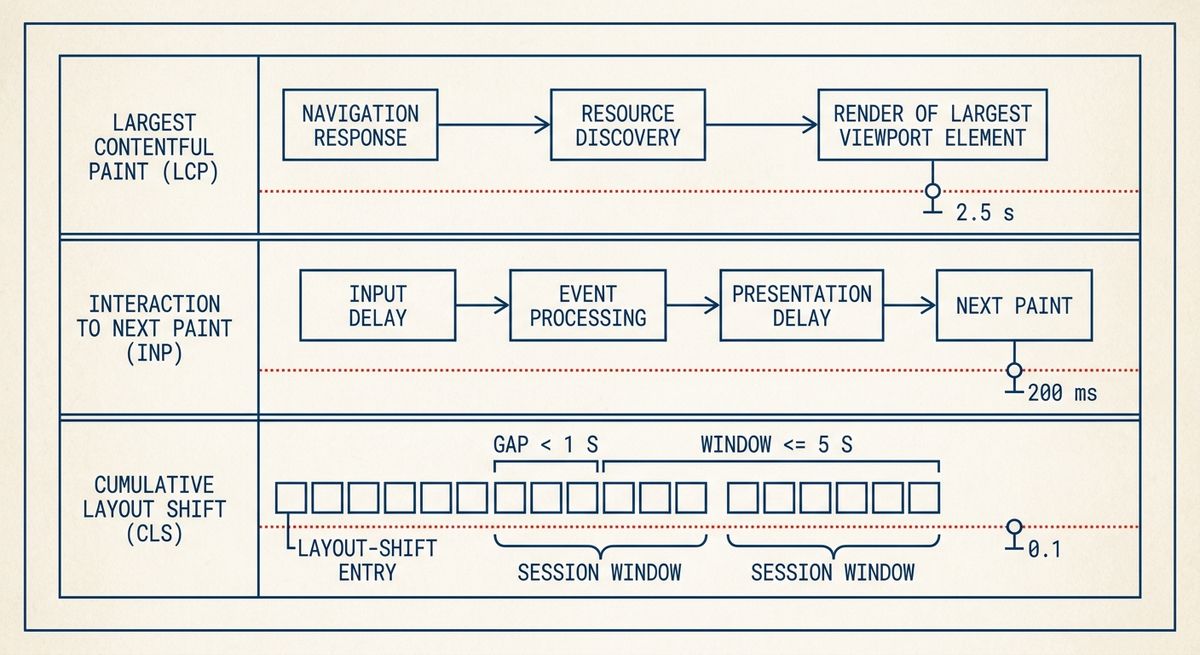
The documented assessment model uses the 75th percentile of real user page loads, commonly separated by form factor. The current thresholds documented for a “good” experience are LCP at or below 2.5 seconds, INP at or below 200 milliseconds, and CLS at or below 0.1. The “poor” thresholds are LCP above 4 seconds, INP above 500 milliseconds, and CLS above 0.25. These numbers are not derived from a single W3C standard; they are public product thresholds layered on top of browser performance specifications.
How it works
At the systems level, the metrics are emitted from the browser’s rendering and event pipelines. LCP is based on the Largest Contentful Paint API, exposed through PerformanceObserver entries of type "largest-contentful-paint". The browser tracks candidate elements in the viewport, such as image elements, video poster or first-frame content, CSS background images loaded through url(), and text blocks. A candidate’s size is the visible area in the viewport, and the metric is the render time of the largest candidate observed before the page is hidden or before the user’s first input changes the loading context.
INP is computed from the Event Timing API. Each qualifying interaction groups low-level events such as pointer, mouse, keyboard, or tap-related events through an interactionId. The duration covers input delay, event callback processing, and presentation delay until the next paint. For pages with many interactions, the documented metric ignores one worst interaction for every 50 interactions, reducing the effect of rare accidental outliers while still making long-tail responsiveness visible. CLS is computed from Layout Instability API entries. Each layout shift has a value equal to impact fraction multiplied by distance fraction, and the metric is the largest session-window sum: shifts separated by less than 1 second, capped at a 5 second window.
What the standard says
Core Web Vitals as a named set is not itself a web standard. Its implementation depends on standards and drafts maintained in the W3C Web Performance Working Group and related browser specifications. Performance Timeline defines PerformanceEntry and PerformanceObserver, including buffered observation. Navigation Timing and Resource Timing expose navigation and subresource timing used for attribution. Paint Timing defines paint entries, while the Largest Contentful Paint specification defines largest-contentful-paint entries with fields such as renderTime, loadTime, size, id, url, and element.
The Event Timing specification defines PerformanceEventTiming, including processingStart, processingEnd, duration, cancelable, target, and interactionId. The documented observer option durationThreshold has a default of 104 milliseconds when omitted and a minimum of 16 milliseconds; durations are rounded, which matters when comparing individual entries with exact thresholds. The Layout Instability specification defines LayoutShift entries, their sources, previousRect and currentRect, value, and the hadRecentInput flag. CLS changed from a lifetime sum to the current session-window maximum, so older articles or dashboards that describe lifetime accumulation are using a superseded definition.
Trade-offs
The measurable trade-offs appear because each metric observes a different part of the browser pipeline. Improving LCP often means prioritising the eventual LCP resource, reducing render-blocking CSS, shortening server response and redirect time measured by Navigation Timing, and avoiding late discovery of hero images. The trade-off is that preload, fetchpriority, and larger early images can move bandwidth away from other resources. Resource Timing fields such as transferSize, encodedBodySize, requestStart, responseStart, and responseEnd make that trade visible without inventing a synthetic score.
Improving INP usually means reducing main-thread work during interactions. The Long Tasks API defines long tasks as tasks exceeding 50 milliseconds, which is useful because long JavaScript execution, style recalculation, layout, and painting can all sit inside the INP duration. Splitting work can improve the tail interaction percentile, but excessive scheduling can increase total completion time or create inconsistent state if rendering is deferred carelessly. Improving CLS often requires reserving dimensions for images, embeds, advertisements, and dynamic UI, but fixed reservations can waste viewport space when content is absent or variable.
Failure modes
Common LCP failures are late resource discovery, render-blocking stylesheets, slow navigation response, client-side rendering that delays meaningful DOM content, and replacing an early candidate with a larger late candidate. Diagnosis starts by identifying the LCP entry’s element and url, then correlating it with Navigation Timing and Resource Timing. If responseStart is late, the bottleneck is before the document arrives. If the image request begins late, discovery or priority is the issue. If the resource loads early but renderTime is late, style, layout, script execution, or decoding is likely in the critical path.
INP failures are usually long event handlers, forced synchronous layout, heavy framework hydration, large DOM updates, or rendering work triggered by a small input. Event Timing entries identify the slow interaction, while Long Tasks show whether the main thread was unavailable. CLS failures are diagnosed from LayoutShift sources: previousRect and currentRect show what moved, and hadRecentInput separates unexpected shifts from shifts caused soon after user input. A common mistake is testing only initial load; CLS can occur after font swaps, late banners, inserted embeds, route transitions, or content revealed by asynchronous data.
A minimal implementation
A correct minimal implementation uses field measurement, not only a lab trace. It registers PerformanceObserver for "largest-contentful-paint" with buffered entries, keeps the last valid LCP candidate until page visibility changes, observes "layout-shift" and accumulates only entries where hadRecentInput is false into the current session window, and observes "event" entries for interaction timing with an explicit durationThreshold. It flushes the final values on visibilitychange and pagehide using a nonblocking transport such as navigator.sendBeacon. The implementation must record page identity, navigation type, visibility state, and enough attribution fields to debug, while avoiding personal data.
Minimal correctness also means respecting lifecycle edge cases. Pages restored from the back-forward cache should be treated as a new observation interval or marked separately, because the user did not perform a normal navigation. Prerendered pages should not be mixed with visible navigations without checking activation timing. Single-page applications need route-level grouping in addition to whole-page metrics, but the underlying browser entries remain document-scoped. The smallest useful dataset stores LCP value and element category, INP value and target category, CLS value and top shift sources, plus the documented threshold classification for each metric.